Tuesday, March 18, 2008

6 reasons to implement a Balanced Scorecard

These days most people know what a balanced scoredcard is. The challenge is understanding the benefits of a balanced scorecard to your organisation. Following on from a previous post Business Intelligence - Scorecards and Dashboards I discuss 6 key reasons to implement a Balanced Scorecard.

Definition: The balanced scorecard is a strategic planning and management system that is used extensively in business and industry, government, and nonprofit organisations worldwide to align business activities to the vision and strategy of the organization, improve internal and external communications, and monitor organisation performance against strategic goals.
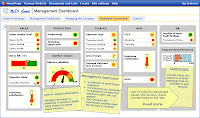

This Balance Scorecard was designed using Sharepoint by enterprise Dashboard.


  • Increase focus on strategy and results

  • Improve organisational performance by measuring what is important

  • Prioritise Projects & Initiatives

  • Align organisation strategy with daily operational tasks

  • Focus on the drivers of future performance

  • Effectively communicate your Vision and Strategy


1. Increase focus on strategy and results

Implementing a balanaced score card requires your team to analyse the internal business processes. Metrics based on these findings allow managers to know how well their business is running, and whether its products and services conform to the strategy and mission.


2. Improve organisational performance by measuring what is important

What is important is defined by what is in the strategy and KPIs extracted from this strategy. By articulating these KPIs and measuring what is important via key metrics - this will improve a organisations performance.


3. Prioritise Projects & Initiatives

Once the each KPI metric is defined the projects required to achieve either the measurement or implementation to achieve strategic objects become more important. Although this is a very simplistic approach to determine what initatives are important - it does provide a basis for prioritising projects.


4. Align organisation strategy with daily operational tasks

In order for an organisation to achieve its strategic goals, daily operational tasks must be aligned to at least one of the strategies KPIs. The daily operational tasks will provide metrics that can be rolled up to provide Business Activity Monitoring. The investigation process will often reveal many daily operational tasks that you can not answer the following questions:


  • Why do we perform this task?

  • How does this task contribute to any of the strategic goals?


5. Focus on the drivers of future performance

Identifying what your future performance drivers are, will provide you with a focus of what activities are important to your organisation. Focusing on what metrics are required to measure the success of your performance drivers will provide you with the start of a roadmap.

6. Effectively communicate your Vision and Strategy

The balanced scorecard transforms an organisation’s strategic plan from an attractive but passive document into the marching orders for the organisation on a daily basis. It provides a framework that not only provides performance measurements, but helps planners identify what should be done and measured. The implementation of the vision and strategy help to communicate what is truly required in daily operational tasks to achieve one or more of the strategies KPIs. Communicating how a strategy relates to daily operational tasks with all staff both executive and operational will help disemeninate the vision.


These six reasons articulate how a Balanced Scorecard enables executives to truly execute their strategies.


Kaplan and Norton (the architects of the Balanced Scorecard) describe the development of the balanced scorecard as:

"The balanced scorecard retains traditional financial measures. But financial measures tell the story of past events, an adequate story for industrial age companies for which investments in long-term capabilities and customer relationships were not critical for success. These financial measures are inadequate, however, for guiding and evaluating the journey that information age companies must make to create future value through investment in customers, suppliers, employees, processes, technology, and innovation."

Friday, March 7, 2008

Put some business intelligence in your inbox

E-mail has already changed business forever, and now business intelligence continues to accelerate that change.

Microsoft's recent partnerships with SAP, Lotus and others are cementing Office applications as a platform for more advanced business software, the new push by Microsoft with PerformancePoint and Business Edge by SAP Business Objects. What may prove a more serious threat to Microsoft's BI moves is not the product plans of other BI vendors but the question of whether up-and-coming online office software, particularly Google Apps, will provide a competing vehicle for BI information.

Instead of trying to predict the next BI takeover, it would make more sense to explore what kind of partnerships SAP Business Objects and others will form with productivity application vendors to make their tools as popular as Microsoft e-mail and spreadsheets. If BI is going to be accessed more directly by business users, it's going to have to start looking more like the tools those users already know.

Fox Business recently announced that AutoRevenue Selects Business Intelligence Leader to Move Reports Online

"Selecting Business Objects, the world's leading business intelligence software, as our reporting platform enables us to provide on-demand reports from our website with a dealer portal," said @utoRevenue General Manager, John Max Miller. "Now our dealership clients will have self-service access to their marketing reports so that they can quickly see the success of their multi-channel sales and service campaigns and other key performance indicators."

Multiple report formats, such as HTML, PDF, Excel and Word files, will be available to @utoRevenue customers online. Dealers will receive e-mail notifications when reports are ready for viewing.

"This process of integrating Business Objects into our web environment will have two phases. First, dealerships will have access on our website to view all their current reports. A second phase will give the end-user the ability to trend data and to drill down into a report and locate specific information they want to know," said Miller. Dealership management will also be able to access real-time dashboards, giving them more control and a top-down view of areas they want to focus on.


The initial release will available to dealers by the end of first quarter 2008.


Microsoft Bill Gates presenting to 100 CEOs in the Beyond Business Intelligence: Delivering a Comprehensive Approach to Enterprise Information Management said
In the decade since that first CEO Summit, technology has transformed the world of business in profound ways. Back then, e-mail was just emerging as a preferred medium for business communication. E-commerce was in its infancy. Most companies still relied on faxes and phone calls to conduct business.

Today, we communicate and collaborate instantly with colleagues, customers and partners around the world. Global supply chains speed the flow of products from factory floor to store shelf. Cell phones are ubiquitous. Mobile access to e-mail is rapidly becoming the norm.

The impact on the workforce is remarkable. Productivity is higher than it's ever been. Buyers can shop the entire world without leaving their desk. Sellers have access to markets that were once beyond reach. The amount of information collected about customers, competitors and markets is unprecedented.

But there are times when it feels like all of these changes have overwhelmed the tools we use to do our day-to-day jobs. I wanted to share my thoughts on this important issue with you and other business decision makers and IT professionals.


The problem, really, is twofold. The first is information overload. Faced with the endless deluge of data that is generated every second of every day, how can we hope to keep up? And in the struggle to keep up, how can we stay focused on the tasks that are most important and deliver the greatest value?

The other problem is something I call information underload. We're flooded with information, but that doesn't mean we have tools that let us use the information effectively.


Business Intelligence: Developing a Query-Driven E-mail Delivery System is another post on MSDN Channel9.

Thursday, February 28, 2008

8 amazing features in Crystal Reports 2008


Crystal Reports 2008 has now unleashed some new powerful and dynamic reporting features not previously seen in a reporting product. We have taken Crystal Reports 2008 for a test drive and we believe "this release has the potential to transform every business user's working environment". Business Objects a provider of business intelligence (BI) solutions, launched Crystal Reports 2008. Reports are the lifeblood of communication between people, business, partners, and customers. Crystal Reports is now fifteen years old. Crystal Reports 2008 continues to provide innovation for both new and existing customers. Crystal Reports 2008 delivers actionable data for any organization with a comprehensive set of new features for business users, report designers and application developers.

Juliette Sultan, Vice President of Information Discovery and Delivery at Business Objects says

"Crystal Reports 2008 brings excitement into reporting. With this release we are addressing the needs of both the report designers and the consumers of the reports. The reaction from our beta customers and partners has been overwhelmingly positive. People are telling us that the game-changing Crystal Reports 2008 has the power to transform decision-making and improve careers."


The release of Crystal Reports 2008 has definitely redefined the reporting experience. Some of the new features include:
• Flexible, interactive report viewing
• Advanced report designer
• More professional looking and persuasive reports
• Comprehensive set of deployment options
• Reduced report proliferation and maintenance
• Reduced design time
• improved designer productivity

Crystal Reports 2008 delivers advanced functionality to help build powerful reports, reduce report proliferation and maintenance, and save time with high-productivity design features. New interactive features include in-report sorting, reformatting and parameter filtering. You can now create visually compelling data presentations by easily embedding Xcelsius and Flash elements. You can save time by adding summary, variance and any other custom calculation into a crosstab row or column without any coding.


1. Xcelsius Integration


Crystal Reports 2008 Xcelsius Integration
What-if scenario like models allow you to visualise the potential outcome of your business decisions and can be built into your reports. Import Xcelsius-generated SWF files into your report and benefit from improved design-time integration. IT and developers will design fewer reports to support the decision making process. Please note: Xcelsius design tool is not included in Crystal Reports 2008.

2. Interactive Report Viewing


Business users can determine answer more business questions with fewer, more flexible reports – significantly reducing Developer and IT support dependency. On-report sorting, filtering, and report reformatting with the .NET Winform, and .NET Webform viewers allows users to explore information interactively without re-querying the database. New optional parameters provide for complex user-driven filtering scenarios.


3. Powerful Crosstabs


Add business-critical information to your reports without coding. Summary, variance, and any other customer calculations can be inserted into a crosstab row or a column – especially useful for reports that benefit from a table structure such as financial reports. The crosstab table structure makes reports much faster to build and maintain. This feature also provides powerful benefits to crosstab-based charts since custom formulas in the crosstab can be visualized within the charts.


4. Advanced Report Publishing


Expand your IT capability and deliver a better customer experience. Also known as report bursting, advanced report publishing is a platform for the mass distribution of personalized content. Multiple reports can be created based on different data sources, combined into one desired file format (such as PDF), loaded with personalized content, and then sent to a dynamic list of recipients—with a single action. The content can be archived, printed, or emailed in separate actions, or simultaneously. This makes scheduling much faster and easier, with the ability to conduct cost effective one-on-one marketing campaigns and other personalized high-volume reporting.

5. Integration with SalesForce.com


The salesforce.com driver included with Crystal Reports 2008 allows for easy access to complete customer data - turning it into actionable business information. Reports that use a salesforce.com driver will refresh when deployed to crystalreports.com.


6. Improved XML Support


Render reports in almost any format and enjoy faster and easier integration with your industry-specific business processes—without any custom coding. The XSLT transformations are embedded into the report file and will be triggered by users from within the viewer when exporting to XML. This provides a powerful, flexible hook for transforming Crystal Reports data and integrating it into other applications.


7. Advanced Paging


Facilitate better online report viewing to your end users. Report designers can customize page size and easily control page breaking after N records/groups. A single report can combine portrait and landscape oriented pages and the white space at the end of groups can be removed by compressing the page footers. Online report consumption is improved because reports are easier to read.


8. Adobe Flash & Flex Integration


Execute business decisions from within the report file. Integrate your reports with operational workflows by embedding Adobe Flex (SWF) applications into your reports. Using Adobe Flex Builder you can create any business-user UI to access report data and integrate with external web services. Data in your report can be passed to the Flex application via Flashvars, making it easy to create a flexible UI even when you don't have access to your data via web services. The Flex applications can do tasks like database write-back - invoking operational workflows directly within Crystal Reports. IT and Developers benefit from instant, coding-free integration of Crystal Reports with your business processes. Please note: Adobe Flex Builder is not included in Crystal Reports 2008.

You can create stunning visualisations with dynamic charts, graphics and video to your reports. A variety of flexible data presentation options are included via Flash. Flash (SWF) files can be integrated into a report, providing interactive and information-rich reports. Flash files can be easily embedded in a report or linked via a website avoiding the need for IT and development time.

Sunday, February 10, 2008

Defining and managing the lifecycle of your data

We are in the process of helping to define the data lifecycle for 2 very different clients.

Data life cycle management (DLM) is a policy-based approach to managing the flow of a companies data throughout its life cycle: from creation and initial storage to its end of life and is deleted. DLM manages the processes involved, typically organising data into separate tiers according to specified policies, and automating data migration from one tier to another based on those criteria. For example a typical rule is; newer data, and data that must be accessed more frequently, is stored on faster, but more expensive storage media, while less critical data is stored on cheaper, but slower media.


I read Krish Krishnan's introduction to the issue of the data lifecycle. He included a reference to Bill Inmons work on Information Lifecycle Management for Data Warehousing. This was fortunate because I have always been an admirer (like so many others in the BI industry) of his work. Recently he published work on Data Warehousing 2.0 - tackling industry trends, unstructured data and the data lifecycle.

DMReview interviewed Bill here, they asked the question why do we need Data Warehouse 2.0 and his response was ...

There are two reasons for DW 2.0 - the first is for the integrity of the definition because I feel there are too many definitions floating around. The second reason is the need for a vision for the future of data warehousing, which I believe a lot of people in the industry have wrong. It came from confusion and from vendors trying to sell products. There were people building transactional systems they were calling a data warehouse; people building federated versions of a data warehouse; people building data marts that they were calling a data warehouse. Those are just some of the renditions.


When asked how do you convince a CEO about the benefits of a datawarehouse he replied ...

The whole subject of return on investment has vexed me. I have seen people take a macro approach. They say, "Okay, the data warehouse was installed, and the stock price of the corporation began to rise." I don't think data warehousing is particularly relevant to a measure like that. I started looking at a micro level and said, "Consider two companies. One company has a data warehouse, one company doesn't. What are the different information capabilities of these two companies?"

The second major case is speed of information. Once the data warehouse is built, the ability to get the information quickly in the hands of the right person in the corporation is greatly facilitated. With DW 2.0, there's also the issue of the data lifecycle, and by recognizing that, you can cut the cost of the data warehouse dramatically.


We have long known that approximately 20% of our data is stored in a structured environment. BI vendors realised it is time to address the 80% of unstructured and semi-structured data. This now provides further insights into our systems and additional understanding of our business and its profitability.

Business Objects recently aquired a product called Insight to use your unstructured text and get a more complete view of your business.

Tuesday, January 29, 2008

Getting 'Real Time' Performance with Operational BI

Operational business intelligence is about delivering information to people when and how they need it in the context of business need. Explore the five best practices best-in-class companies are using to drive faster, better decision making and higher customer satisfaction.


I read a post on the Intelligent enterprise website about getting real time performance from your business intelligence infrastructure.

A number of companies have started to use existing data to provide daily, even minute by minute information. Traditional business intelligence solutions continue to address the strategic information needs of decision makers with analysis of historical data. A number of companies are now realising the potential of applying Business Intelligence to more immediate operational needs. A number of vendors included Business Objects and Micrsoft providing support for the day to day operational needs of a company.


David Hatch from Intelligent enterprise says key benefits to business users include the opportunity to:


  • Manage business activities as they occur, as opposed to waiting for the end of a day, week, or month before gaining access to analytical data and information;


  • Improve customer relations by responding to their needs more rapidly, and heading off harmful events before the customer is aware, or possibly before they happen;


  • Increase business efficiency by providing actionable information to line-level knowledge workers in real-time, and automating manual processes to reduce costly, repetitive report creation tasks.


THE 'FLAVORS' OF OPERATIONAL BI


The term "operational BI" has been identified with several terms within various industry and market vernaculars, including "transactional BI, real-time analytics, near-real-time analytics, operational reporting, business activity monitoring" and "decision management." Some of the terms have been coined to differentiate between the timeframes within which data collection, reporting, and analysis occur. Other terms describe differences in the methods and calculations that take place as data is captured, manipulated, and delivered.

Whether your company has a business intelligence environment or thinking about youre requirements - everyone can benefit from Operational Business Intelligence!

Click here for more information about Operational Business Intelligence.

Sunday, January 27, 2008

Megatrends of Business Intelligence

Complacency ... Enterprises seeking a competitive edge are looking toward competency centers, MDM, real-time deployments, data virtualization, workload management and operational intelligence. We help you answer six questions that will lead to innovative new BI strategies.


We came across this post that summarised changes and predictions in the BI market by intelligent enterprise.

Just when everyone thought there was general agreement on what business intelligence (BI) is "methods, tools and systems for manipulating quantitative data to build views and perform analysis for decision-making" the industry changes so much that we may again have competing definitions.

As the New Year unfolds, it would be easy to reduce what happened to the BI industry in 2007 to one colossal megatrend: consolidation. Oracle bought Hyperion Software. SAP acquired Business Objects (and a few others). And Cognos, which itself acquired Celequest in late 2006 and Applix in 2007, is in the process of being snapped up by IBM. To be sure, several important BI tool and platform players are still independent, including Actuate, Datawatch, Information Builders, MicroStrategy, Panorama and SAS. Also unchanging is the growing presence of Microsoft, not to mention that of open source BI, the domain of Pentaho and Jaspersoft. Performance management and specialized data- and text-analytics vendors still abound. Nonetheless, it feels like the industry as a whole has turned in a new direction and will never again resemble its pre-2007 self.

Could there be more consolidation in 2008? Entirely possible: If nothing else, IBM, Microsoft, Oracle and SAP are now markets unto themselves and will undoubtedly stay on the hunt to acquire software products and services that fill holes and create competitive advantages. This article explores how the consolidation trend might play out, but more importantly it presents six important megatrends in the context of questions organizations and BI practitioners must answer as they evaluate software and work to deliver on key strategies with BI.

Click here for the complete article.

Tuesday, January 8, 2008

Operational BI: Getting the whole company using Business Intelligence

The major vendors are all making conversations about Operational BI or Pervasive BI.

Companies are trying to raise the competitive bar through improvement of many operational business processes, including customer experiences, inventory
and purchasing, systems monitoring, and business process optimisation. Organizations are attempting to increase customer loyalty, profitability, and cross-sell / upsell opportunities.

Many companies are now being pushed to deliver results despite budget constraints. This has resulted in a focus on cost and business process efficiency monitoring that will help find efficiencies and improve the bottom line.

While traditional business intelligence solutions continue to address the strategic information needs of decision makers with analysis of historical data, organizations
are starting to realize the potential of applying BI technology and approaches to more immediate information needs. The study will determine what companies are
doing to:
• Target and prioritize operational BI initiatives
• Improve customer relations, response, and performance
• Address non-customer facing operational process improvements
• Increase the availability of information for both customer-facing and other line-level knowledge
workers
• Monitor systems for opportunities to improve business performance and reduction of harmful events

The dmReview talk about "The Next Generation of Business Intelligence: Operational BI". They say ...

Operational reporting applications simply format and display the content of BTx data stores. Many business users, however, want to be able to analyze BTx data to identify potential problems and look for business trends. There are a wide variety of analysis tools available on the market. The capabilities provided by these products range from using Microsoft Excel for data analysis to advanced OLAP applications and database systems.


Operational Business Intelligence has also been labelled BI 3.0 or the next evolution of business intelligence. We recently implemented a BI solution for a client that included strategic aswell as operational Business Intelligence.

Thursday, January 3, 2008

Making Business Intelligence for the masses !

I saw this video a while ago but found it on YouTube recently ...

This is Business Objects Performance Enlightenment video - let there be light.


"We are not a business intelligence company ... we are in the business of helping companies become more intelligent!"

Wednesday, January 2, 2008

Benefits of Strategic Data Analysis

Benefits of Strategic Data Analysis

It is very obvious that analysing your data can provide strategic benfits. But I am often asked how can I do it easily. There are a number of reasons to undertake strategic data analysis including:

economic pressures, just-in-time supply chain management, a more diverse and demanding customer base and government requirements such as Sarbanes-Oxley (SOX).
Business Intelligence (BI) tools bring information and insights to your business previously unknown and this is occurring in many other large and mid-sized organisations around the world.

Strategic data analysis benefits an organisation in many ways including:

  • Providing access to statistical and other reporting tools that expose the hidden data that is driving change and growth in an organisation but is rarely measured.
  • Providing a single point of view into diverse data through the implementation of data mining and data farming techniques.
  • Identifying non-traditional value measurements that are often overlooked.
  • Creating the ability to acquire pertinent data needed to make quality decisions based upon actual business trends and conditions.
  • Providing a way to link strategic enterprise data to current and planned business activities.
  • Providing access to competitive intelligence in order to create a competitive advantage.
  • Tracking and measuring Key Performance Indicators.

Effective decision support systems depend upon management’s ability to understand an organisation’s underlying data. Key business activities including sales and marketing activities, financial and human resources management and planning, and the activities of other departments are improved when key decision makers have access to the tools necessary to perform strategic data analysis. ools to the forefront of many large and mid-sized organisations around the world.

The gap between the ability to link business performance with strategic data is being bridged by the technology delivered by Business Intelligence (BI) tool providers such as Microsoft, Oracle and Business Objects.

Recognising that different businesses have different BI needs, Microsoft offers a suite of BI tools that scale to fit the needs of both technical and non-technical users in small, mid-size and large organisations. These tools are fully compatible with its own line of database products as well as those provided by SAP and other manufacturers. ools to the forefront of many large and mid-sized organisations around the world.

Viewed more as a BI and strategic data analysis tool provider for mid-sized and large organisations, Oracle offers business intelligence and data warehousing tools including a suite of ETL, OLAP, and Data Mining software products.

Business Objects is also a key player in the strategic data analysis and BI market with their suite of tools that supports major manufacturers including Siebel, Teradata, SAP, PeopleSoft, Oracle and Informatica.

The journey to improving business performance begins with the organisations commitment to performing strategic data analysis and employing BI solutions from the industry’s leading suppliers of quality BI and strategic data analysis tools.

Tuesday, January 1, 2008

The benefits of Business Intelligence

The Benefits of Business Intelligence

I am often asked what can Business Intelligence do for my business. So my response is usually ...

Business Intelligence (BI) is both a management process as well as a collection of software applications and underlying technology that enables organisations to make better business decisions by exposing key metrics that drive the organisation
.

Business Intelligence is sometimes confused with Competitive Intelligence but they are not the same concepts. This is true even though BI technology does give management a methodology for getting a better grasp on the internal and external forces that are driving their organisation as well as a way to measure their organisation’s performance against the performance of their competitors.

Properly used, BI systems assist management in developing a data-based decision making model that provides more consistent results when compared to non-BI methods. Organisations that have successfully implemented BI systems have better and timelier access to customer activities, marketplace trends, supply chain issues and a host of other key performance indicators (KPIs) that are not able to be easily measured in a non-BI environment.


The Technology Behind The Business Intelligence Process

All of the data that BI systems access comes from the organisation’s data warehouse which is a specially-designed database that stores integrated data from various sources from within the organisation.

Business intelligence analysts perform data mining, which is the process of analyzing the data in the data warehouse to uncover patterns and relationships, using specialised BI tools such as Microsoft BI, Oracle BI and Business Objects BI.

Because BI needs vary among business sectors, many BI tools are highly industry-specific. Even so, most BI tools provide a similar core suite of capabilities which include executive reporting tools and a management dashboard that aggregates data and provides a high-level view of the organisation from a BI perspective.

Many organisations employ BI strategies in order to support the Balanced Scorecard (BSC) success measurement program. Unlike traditional measurements which are solely financial-based, the BSC approach measures both the financial lagging indicators as well as well as a variety of future performance indicators which are called leading measures. The BSC approach works so well because it not only provides a means for analyzing financial indicators, it also provides a way to quantify an organisation's other value drivers including its learning and growth perspective, business process perspective and its customer perspective.

Companies such as Exxon/Mobile and Cigna Insurance credit their profitability and explosive growth to implementing a BI/BSC strategy that enabled them to precisely gauge their market opportunities and position their companies to become financial and performance leaders in their market niches.

Business Intelligence is a process that works for any size organisation that is dedicated to gaining a competitive edge and raise their visibility in a crowded marketplace.